
Fact-based. Evidence-led.
UK disability data, in one place.
Numbers can expose barriers—but only when we say clearly who was counted, where the data applies and what the figure actually means.
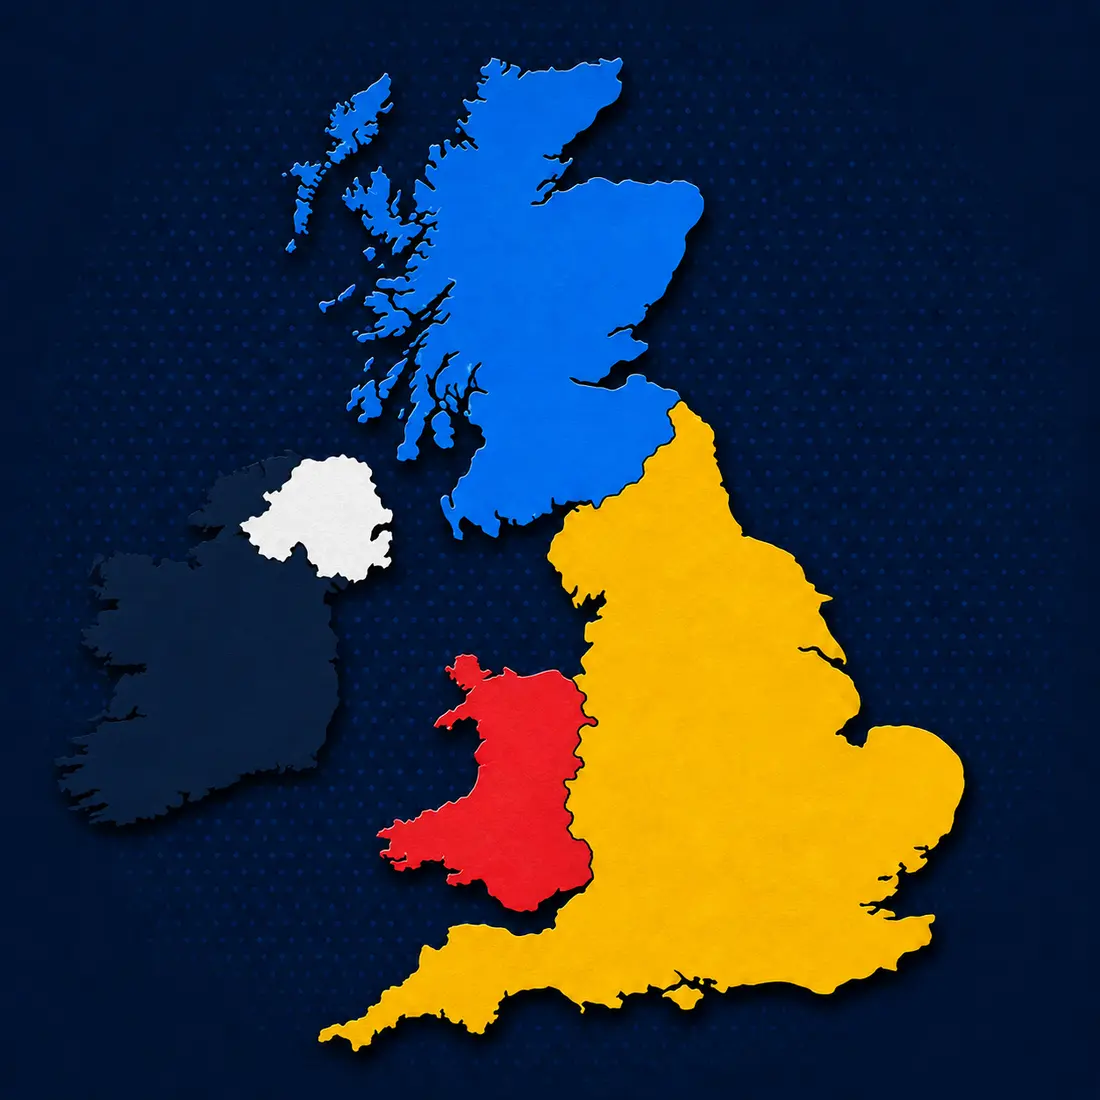
This page shows UK-wide evidence only. Choose England, Scotland, Wales or Northern Ireland to explore data for that nation.
Sources reviewed September 2026
01 — The UK picture
Disability is part of everyday life.
These figures cover the whole UK. They show scale, but the national average can hide much larger gaps for particular groups and places.
United Kingdom · 2024–25
1 in 4people in the UK are disabled.
That is 16.7 million people living in private households. The survey classifies 25% of the population as disabled.
United Kingdom · April to June 2025
52.8%of disabled working-age people were employed.
The comparable rate for non-disabled people was 82.5%. Around 5.5 million disabled people were in employment.
United Kingdom · April to June 2025
29.7percentage-point employment gap.
This is the difference between disabled and non-disabled employment rates. The gap is not the same in every nation, region or impairment group.
United Kingdom · 2023
12.7%disability pay gap.
Median hourly pay was £13.69 for disabled employees and £15.69 for non-disabled employees.
02 — The four nations
The gap changes depending on where you live.
Select a nation to see its figures, explanations and official sources. Nation-specific data is kept off this UK overview so the information is easier to follow.




03 — Learning disability
Different datasets count different people.
This UK-wide survey category is broader than the social-care definitions used by individual nations. Choose a nation above to see nation-specific learning-disability evidence.
United Kingdom · year ending June 2021
26.2%employment rate for disabled people reporting severe or specific learning difficulties.
This Annual Population Survey category is self-reported and broader than the social-care definition used for the 6% figure.
What is missing?
We still do not have one current, like-for-like learning-disability employment measure for all four UK nations.
That absence matters. Without consistent data, it is harder to compare progress and hold systems accountable.
04 — Autism and neurodiversity
The disparity is visible. The wider data is not complete.
Autism appears in national impairment data. ADHD, dyslexia, dyspraxia and other forms of neurodivergence are not consistently identifiable in the main UK labour-market datasets.
United Kingdom · year ending June 2021
29%employment rate for disabled autistic people.
This was one of the lowest employment rates among the impairment groups measured by the Annual Population Survey.
United Kingdom · 2023
27.9%pay gap for disabled employees with autism as their main impairment.
It was one of the widest impairment-specific pay gaps reported by ONS.
United Kingdom · graduate outcomes data for 2022
36%of autistic graduates were in full-time work 15 months after graduating.
The review also reports autistic graduates were twice as likely to be unemployed as non-disabled graduates.
Data gap
“Neurodivergent” is not one condition or one experience.
We will not invent a single employment rate where no robust, comparable UK figure exists. Better data should distinguish groups while recognising people with more than one condition.
05 — Work and pay
Getting a job is only part of the story.
Disabled people are also more likely to leave work, less likely to move into work and more likely to experience low pay or insecure conditions.
United Kingdom · average 2014–2024
10.1%average annual rate of moving out of work for disabled workers.
The comparable rate for non-disabled workers was 4.6%.
United Kingdom · average 2014–2024
7.6%average annual rate of moving into work for workless disabled people.
The comparable rate for workless non-disabled people was 28.3%.
United Kingdom · 2023
20.3%pay gap for employees with severe or specific learning difficulties.
The figure describes people already in paid employment and is separate from the employment-rate measures.
06 — Everyday life
Disparity does not stop at the workplace.
Attitudes, safety, relationships and housing shape whether people are heard, included and able to take part.
United Kingdom · Scope research · previous five years
72%experienced negative attitudes or behaviour.
Of those who experienced it, 87% said it had a negative effect on their daily lives.
United Kingdom · Sense research · 2023
53%of people with complex disabilities felt lonely.
Respondents said they felt lonely often, always or some of the time, compared with 25% of the general public.
United Kingdom · year ending June 2021
24.9%of disabled working-age people rented social housing.
The comparable figure for non-disabled people was 7.9%. Disabled people were also less likely to own their home.
How we use evidence
A number needs context.
Coverage: Every card says whether it covers the UK, one nation or a specific research sample.
Definitions: “Disabled”, “learning disability”, “learning difficulty” and “neurodivergent” are not interchangeable labels.
Comparability: We do not combine survey and administrative figures into a false UK total.
Updates: We show the period measured—not only the date the report was published—and review sources when new releases appear.
Behind every percentage is a person.